Faster Reports, Smarter Queries: Test LearnDash’s Performance Upgrade
We know how important fast, reliable reporting is for LearnDash site owners, developers, and integration partners. That’s why we’ve made a major optimization to the way LearnDash pulls reporting data—one that significantly improves performance on larger databases.
Now, we’re inviting you to test this update in a release candidate before it goes live. In this post, we’ll walk through what we changed, how we did it, and the impact it has on reporting performance. Then, we’ll show you how to get early access and help us fine-tune it.
Why We Took on This Project
LearnDash’s reporting queries power everything from admin dashboards to user progress tracking, but they’ve been increasingly slow for sites with large amounts of data.
The core problem?
- A function called
learndash_reports_get_activity()was handling all reporting queries in one go. - It worked well for smaller sites but struggled when databases grew.
- Some reports timed out, while others used excessive memory just to load.
Instead of small fixes, we went for a smarter, long-term solution. This update rewires how we pull report data—dramatically improving load times and memory efficiency, especially for sites with thousands of users, courses, and quiz attempts.
How We Optimized the Query
Instead of relying on wp_users, we now pull data directly from the more efficient wp_learndash_user_activity table.
Key changes:
✅ Switched data sources to query directly from activity tables instead of user tables.
✅ Reworked JOIN operations to return the same data format but with far less overhead.
✅ Reduced memory usage by removing unnecessary query loops that were causing slowdowns.
✅ Made queries scale better so they perform well even on LearnDash sites with tens of thousands of users.
This optimization means reports load significantly faster, and sites with high traffic or complex reporting needs should see immediate performance gains.
How Much Faster Is It? Our Test Case Results
We ran this update on a variety of LearnDash databases, from small sites to massive installs.
But here’s just one test case, where the results speak for themselves.
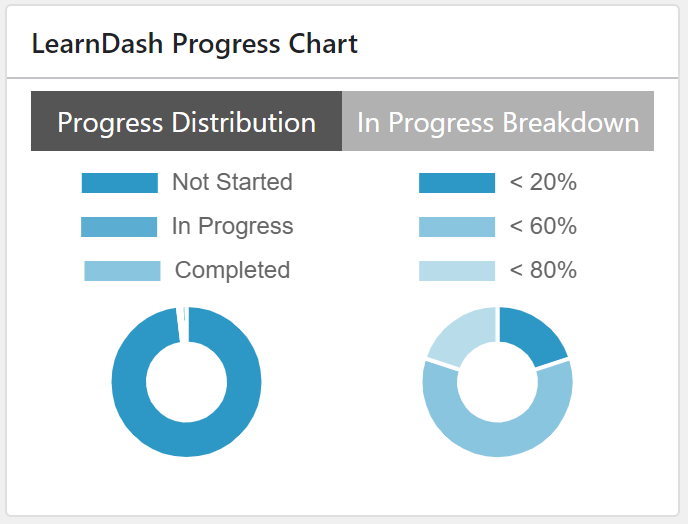
This test compares the loading time before and after for the Progress Chart Widget.
Below are the test results comparing the current version (main branch) with the updated release candidate, along with the estimated percentage improvements:
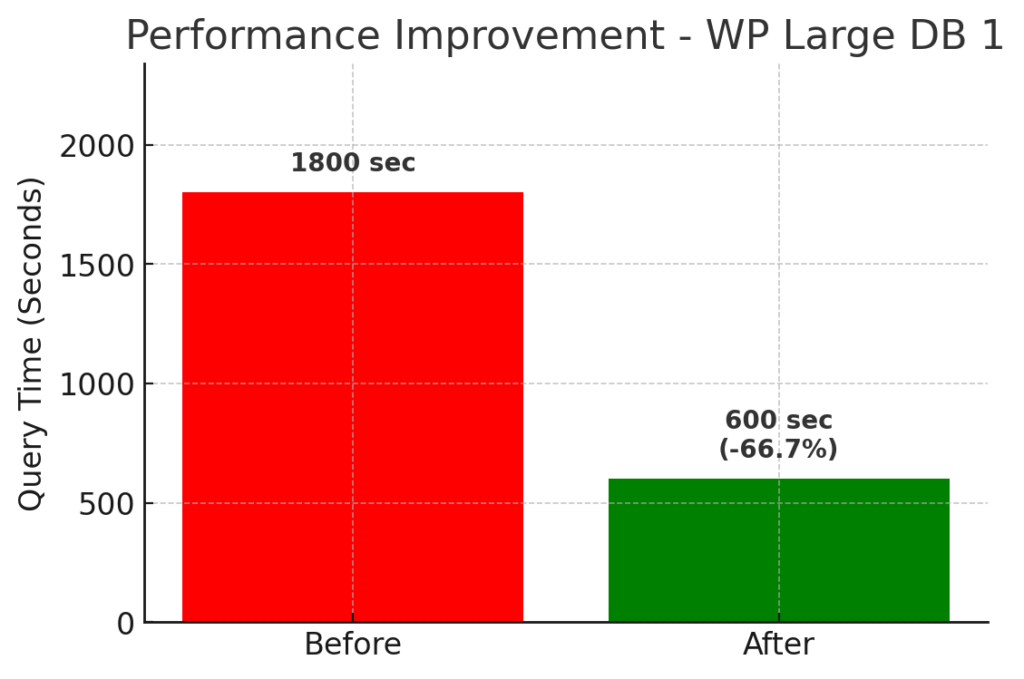
Large Database 1 | (30K users | 1K courses | 2K users enrolled in 200 random courses):
- Before: The query would time out (over 30 minutes).
- After: The query completes in about 10–30 minutes.
- Improvement: In cases where the query previously timed out, we’re now seeing a reduction in load time by up to roughly 33–66% compared to the worst-case scenario.
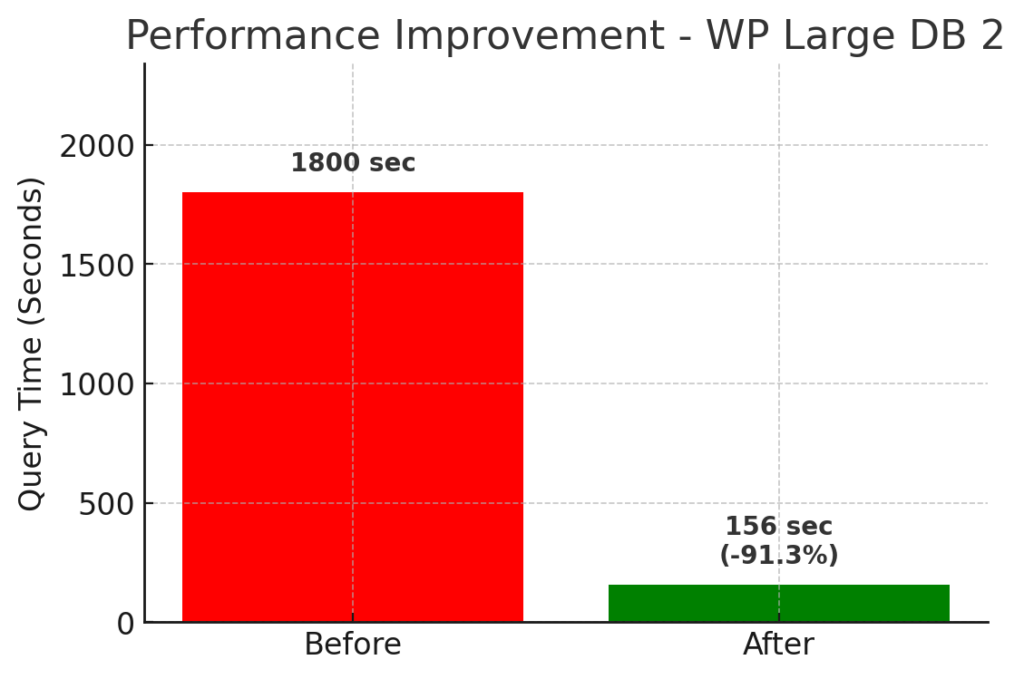
Large Database 2 | (30K users | 1K courses | 15K users enrolled in 10 random courses):
- Before: The query would time out (over 30 minutes).
- After: The query now completes in about 2.6 minutes.
- Improvement: This represents an estimated improvement of over 90% in load time.
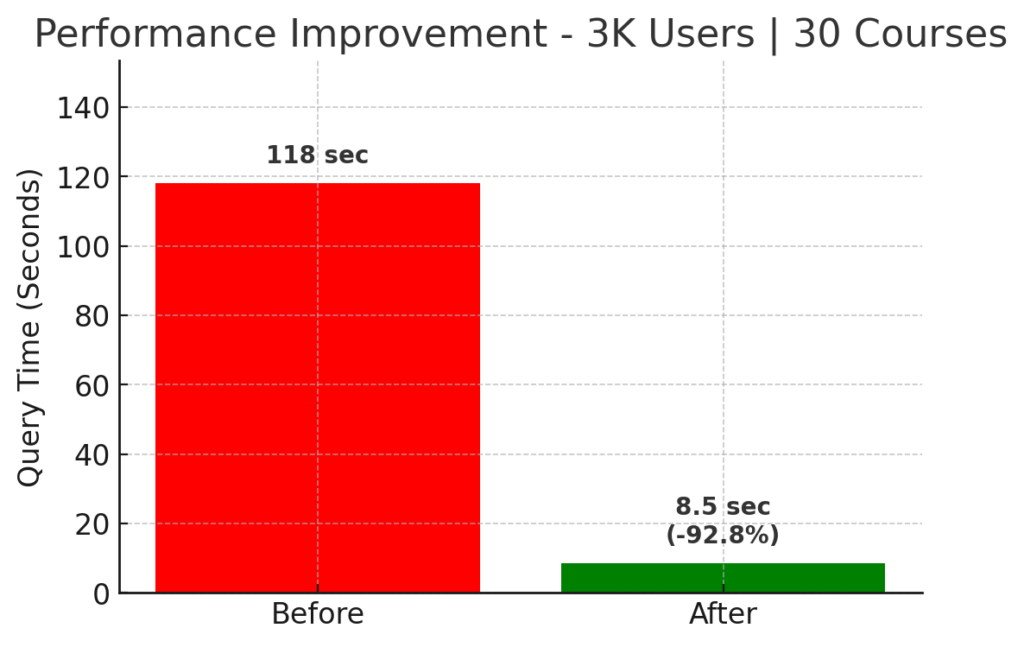
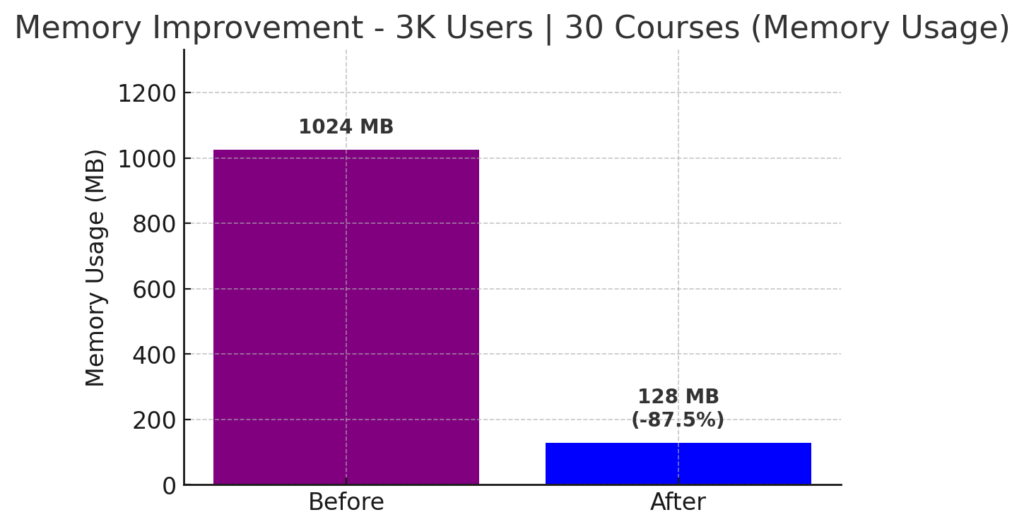
Average Database | 3K Users | 30 Courses:
- Before: The query took about 118 seconds.
- After: It now takes roughly 8.5 seconds.
- Improvement: This is a reduction in query time of approximately 93%.
The update also significantly reduced memory usage:
- Before: Over 1024 MB
- After: Less than 128 MB
- Improvement: 87.5% reduction in memory usage
Small Database | 100 Users | 10 Courses:
- Before and After: There was no noticeable difference in load time.
- Improvement: As expected, smaller databases already performed well, so the changes have minimal impact in this scenario.
These numbers confirm that the new query structure is far more efficient, especially for larger LearnDash sites that previously struggled with slow or failing reports.
Test It Yourself: Get Early Access to the Release Candidate
We’ve tested this internally, but nothing beats real-world testing across different LearnDash setups. That’s where you come in!
✅ If you manage LearnDash sites with thousands of users or heavy reporting needs, your feedback is especially valuable.
✅ If you build custom integrations or add-ons, this is a chance to ensure compatibility early.
✅ If you’ve ever waited too long for a report to load, this update is for you.
How to Get Access
Fill out this form to get the release candidate and test it on your staging or development site. The more test cases we get, the better we can ensure this update is solid before full release.
Thank you for helping us make LearnDash reporting better than ever! 🚀